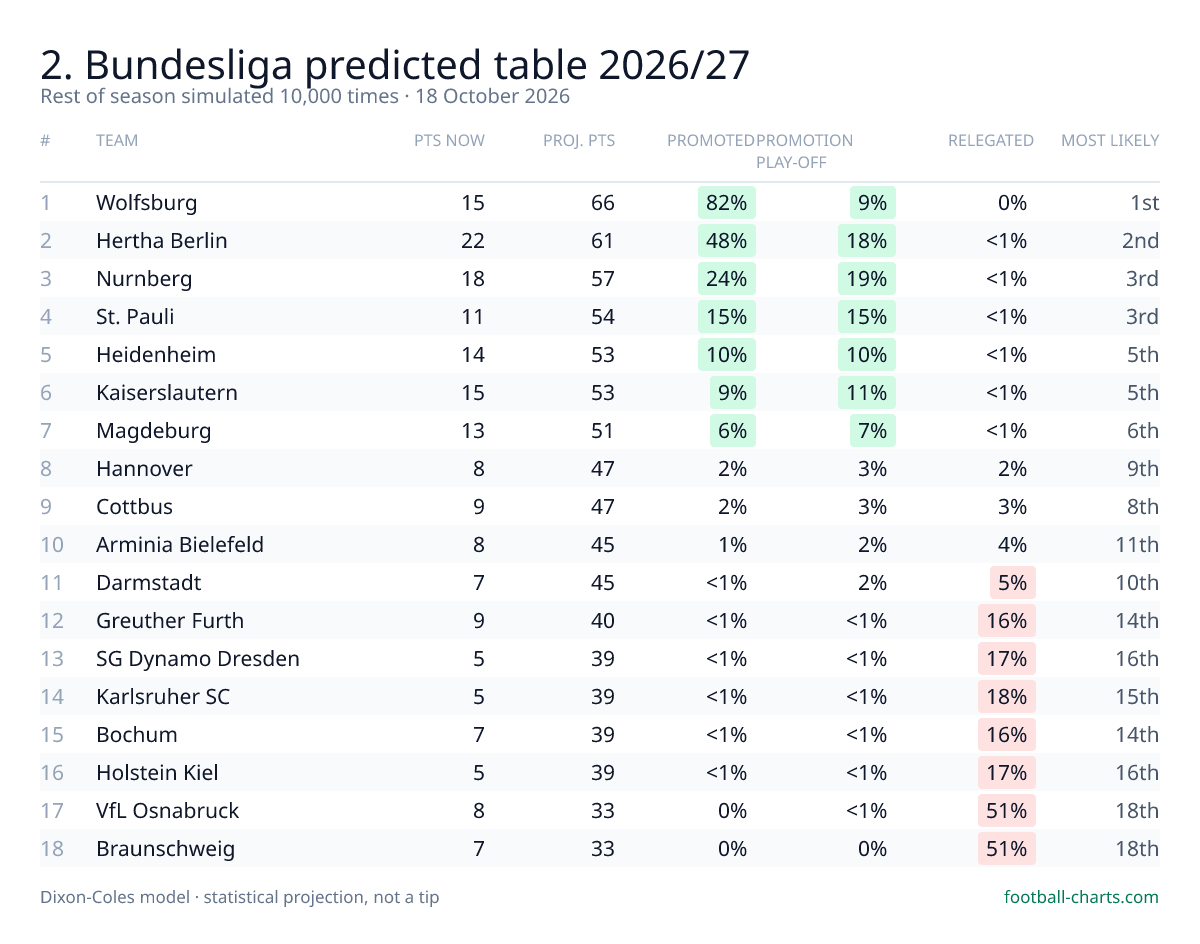
2. Bundesliga predicted table 2026/27
Germany · The rest of the season simulated 10,000 times · updated 18 October 2026
- Wolfsburg are the most likely 2. Bundesliga champions, finishing first in 61% of 10,000 simulations (projected 66 points; Hertha Berlin next on 20%).
- Braunschweig (51%), VfL Osnabruck (51%) are more likely than not to finish in the relegated places.
- VfL Osnabruck sit 11th today but are projected to finish 17th — the model expects them to drop below their current position.
| # | Team | P | Pts now | Proj. pts | Promoted | Promotion play-off | Relegated | Most likely |
|---|---|---|---|---|---|---|---|---|
| 1 | Wolfsburg | 8 | 15 | 6658–74 | 82% | 9% | 0% | 1st (61%) |
| 2 | Hertha Berlin | 8 | 22 | 6152–69 | 48% | 18% | <1% | 2nd (29%) |
| 3 | Nurnberg | 8 | 18 | 5748–65 | 24% | 19% | <1% | 3rd (19%) |
| 4 | St. Pauli | 8 | 11 | 5446–63 | 15% | 15% | <1% | 3rd (15%) |
| 5 | Heidenheim | 8 | 14 | 5344–61 | 10% | 10% | <1% | 5th (13%) |
| 6 | Kaiserslautern | 8 | 15 | 5344–61 | 9% | 11% | <1% | 5th (13%) |
| 7 | Magdeburg | 7 | 13 | 5142–59 | 6% | 7% | <1% | 6th (11%) |
| 8 | Hannover | 8 | 8 | 4739–56 | 2% | 3% | 2% | 9th (10%) |
| 9 | Cottbus | 8 | 9 | 4738–55 | 2% | 3% | 3% | 8th (10%) |
| 10 | Arminia Bielefeld | 7 | 8 | 4537–54 | 1% | 2% | 4% | 11th (10%) |
| 11 | Darmstadt | 7 | 7 | 4536–53 | <1% | 2% | 5% | 10th (10%) |
| 12 | Greuther Furth | 8 | 9 | 4031–48 | <1% | <1% | 16% | 14th (12%) |
| 13 | SG Dynamo Dresden | 7 | 5 | 3931–48 | <1% | <1% | 17% | 16th (11%) |
| 14 | Karlsruher SC | 7 | 5 | 3931–48 | <1% | <1% | 18% | 15th (11%) |
| 15 | Bochum | 8 | 7 | 3931–48 | <1% | <1% | 16% | 14th (12%) |
| 16 | Holstein Kiel | 8 | 5 | 3931–47 | <1% | <1% | 17% | 16th (11%) |
| 17 | VfL Osnabruck | 7 | 8 | 3326–42 | 0% | <1% | 51% | 18th (30%) |
| 18 | Braunschweig | 8 | 7 | 3325–41 | 0% | 0% | 51% | 18th (30%) |
Order = average final points across all simulations. Proj. pts shows the average and the 10th–90th percentile range. Percentages are the share of simulations in which the club finishes in that zone.
How this table is made
Every club gets an attack and a defence rating from a Dixon-Coles model fitted to the league's results (recent matches weigh more). Each of the 237 remaining scheduled fixtures is then played out 10,000 times by sampling a scoreline from the model, and the final table of each run is recorded. Ties are separated by goal difference, then goals scored; head-to-head rules, point deductions and split rounds are not modelled. This is a statistical projection, not a tip.
How good are the model's probabilities? Its match forecasts are scored publicly, every match, on the calibration record.
Use this table
Free to republish with credit and a link to this page (CC BY 4.0). Journalists: contact@football-charts.com for a club-specific version.