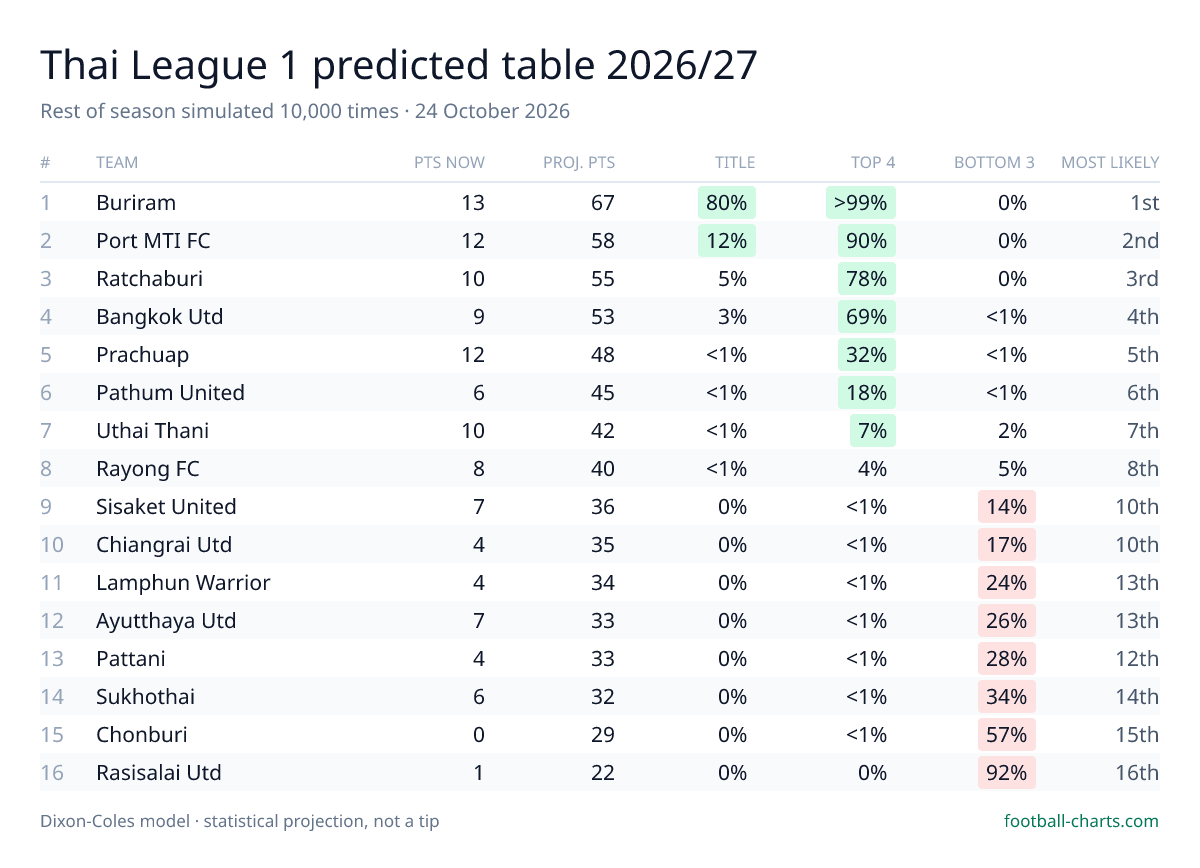
Thai League 1 predicted table 2026/27
Thailand · The rest of the season simulated 10,000 times · updated 24 October 2026
- Buriram are the most likely Thai League 1 champions, finishing first in 80% of 10,000 simulations (projected 67 points; Port MTI FC next on 12%).
- Rasisalai Utd (92%), Chonburi (57%) are more likely than not to finish in the bottom 3 places.
- Pathum United sit 10th today but are projected to finish 6th — the model rates them well above their current position.
| # | Team | P | Pts now | Proj. pts | Title | Top 4 | Bottom 3 | Most likely |
|---|---|---|---|---|---|---|---|---|
| 1 | Buriram | 5 | 13 | 6760–74 | 80% | >99% | 0% | 1st (80%) |
| 2 | Port MTI FC | 5 | 12 | 5851–66 | 12% | 90% | 0% | 2nd (41%) |
| 3 | Ratchaburi | 5 | 10 | 5547–62 | 5% | 78% | 0% | 3rd (29%) |
| 4 | Bangkok Utd | 5 | 9 | 5345–61 | 3% | 69% | <1% | 4th (26%) |
| 5 | Prachuap | 5 | 12 | 4840–56 | <1% | 32% | <1% | 5th (24%) |
| 6 | Pathum United | 5 | 6 | 4537–53 | <1% | 18% | <1% | 6th (21%) |
| 7 | Uthai Thani | 5 | 10 | 4234–49 | <1% | 7% | 2% | 7th (18%) |
| 8 | Rayong FC | 5 | 8 | 4032–48 | <1% | 4% | 5% | 8th (16%) |
| 9 | Sisaket United | 5 | 7 | 3629–44 | 0% | <1% | 14% | 10th (13%) |
| 10 | Chiangrai Utd | 5 | 4 | 3527–43 | 0% | <1% | 17% | 10th (13%) |
| 11 | Lamphun Warrior | 5 | 4 | 3426–42 | 0% | <1% | 24% | 13th (13%) |
| 12 | Ayutthaya Utd | 5 | 7 | 3326–41 | 0% | <1% | 26% | 13th (14%) |
| 13 | Pattani | 5 | 4 | 3326–41 | 0% | <1% | 28% | 12th (14%) |
| 14 | Sukhothai | 5 | 6 | 3225–40 | 0% | <1% | 34% | 14th (15%) |
| 15 | Chonburi | 5 | 0 | 2921–36 | 0% | <1% | 57% | 15th (25%) |
| 16 | Rasisalai Utd | 5 | 1 | 2215–29 | 0% | 0% | 92% | 16th (67%) |
Order = average final points across all simulations. Proj. pts shows the average and the 10th–90th percentile range. Percentages are the share of simulations in which the club finishes in that zone.
How this table is made
Every club gets an attack and a defence rating from a Dixon-Coles model fitted to the league's results (recent matches weigh more). Each of the 200 remaining scheduled fixtures is then played out 10,000 times by sampling a scoreline from the model, and the final table of each run is recorded. Ties are separated by goal difference, then goals scored; head-to-head rules, point deductions and split rounds are not modelled. This is a statistical projection, not a tip.
How good are the model's probabilities? Its match forecasts are scored publicly, every match, on the calibration record.
Use this table
Free to republish with credit and a link to this page (CC BY 4.0). Journalists: contact@football-charts.com for a club-specific version.