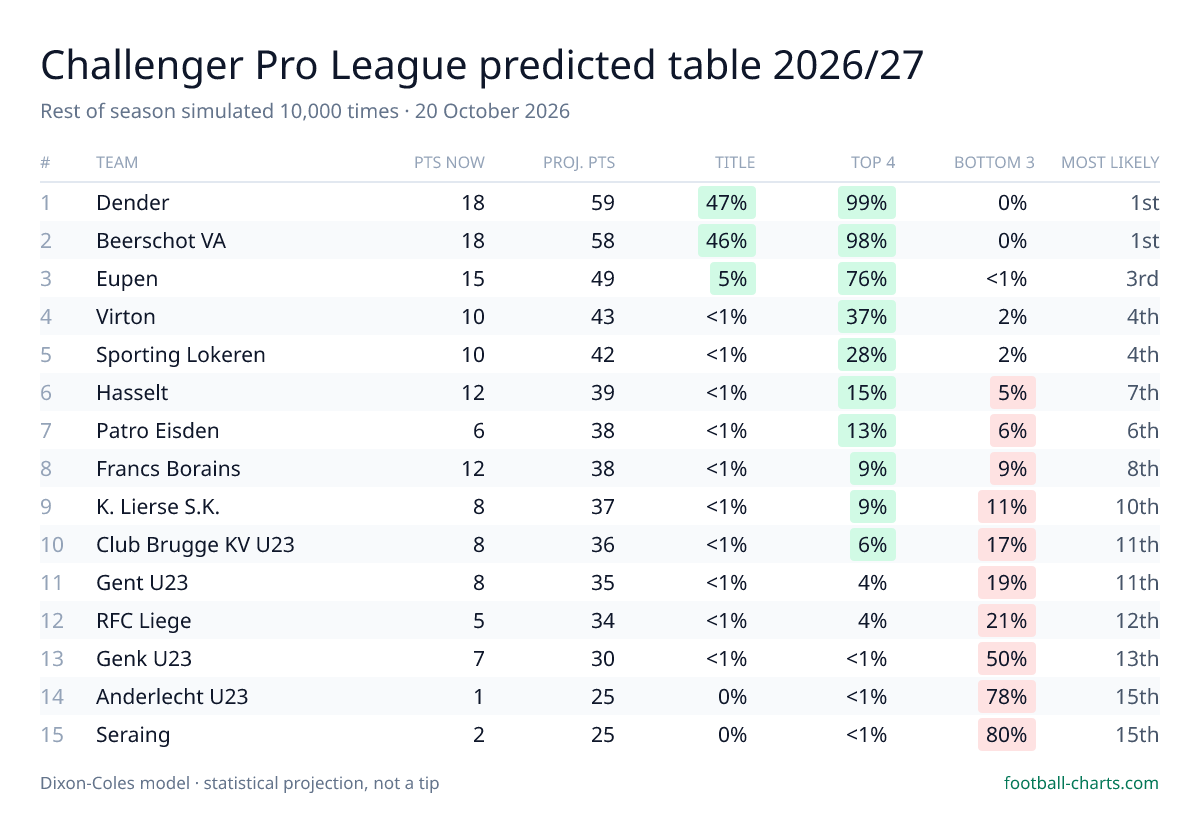
Challenger Pro League predicted table 2026/27
Belgium · The rest of the season simulated 10,000 times · updated 20 October 2026
- Dender are the most likely Challenger Pro League champions, finishing first in 47% of 10,000 simulations (projected 59 points; Beerschot VA next on 46%).
- Seraing (80%), Anderlecht U23 (78%), Genk U23 (50%) are more likely than not to finish in the bottom 3 places.
- Patro Eisden sit 12th today but are projected to finish 7th — the model rates them well above their current position.
| # | Team | P | Pts now | Proj. pts | Title | Top 4 | Bottom 3 | Most likely |
|---|---|---|---|---|---|---|---|---|
| 1 | Dender | 7 | 18 | 5951–66 | 47% | 99% | 0% | 1st (47%) |
| 2 | Beerschot VA | 7 | 18 | 5851–66 | 46% | 98% | 0% | 1st (46%) |
| 3 | Eupen | 6 | 15 | 4941–57 | 5% | 76% | <1% | 3rd (38%) |
| 4 | Virton | 6 | 10 | 4335–51 | <1% | 37% | 2% | 4th (20%) |
| 5 | Sporting Lokeren | 6 | 10 | 4234–49 | <1% | 28% | 2% | 4th (16%) |
| 6 | Hasselt | 7 | 12 | 3932–47 | <1% | 15% | 5% | 7th (13%) |
| 7 | Patro Eisden | 7 | 6 | 3831–46 | <1% | 13% | 6% | 6th (12%) |
| 8 | Francs Borains | 6 | 12 | 3830–45 | <1% | 9% | 9% | 8th (12%) |
| 9 | K. Lierse S.K. | 6 | 8 | 3729–45 | <1% | 9% | 11% | 10th (12%) |
| 10 | Club Brugge KV U23 | 6 | 8 | 3628–43 | <1% | 6% | 17% | 11th (12%) |
| 11 | Gent U23 | 6 | 8 | 3527–42 | <1% | 4% | 19% | 11th (12%) |
| 12 | RFC Liege | 7 | 5 | 3427–42 | <1% | 4% | 21% | 12th (12%) |
| 13 | Genk U23 | 7 | 7 | 3022–37 | <1% | <1% | 50% | 13th (20%) |
| 14 | Anderlecht U23 | 7 | 1 | 2518–33 | 0% | <1% | 78% | 15th (37%) |
| 15 | Seraing | 7 | 2 | 2517–32 | 0% | <1% | 80% | 15th (39%) |
Order = average final points across all simulations. Proj. pts shows the average and the 10th–90th percentile range. Percentages are the share of simulations in which the club finishes in that zone.
How this table is made
Every club gets an attack and a defence rating from a Dixon-Coles model fitted to the league's results (recent matches weigh more). Each of the 161 remaining scheduled fixtures is then played out 10,000 times by sampling a scoreline from the model, and the final table of each run is recorded. Ties are separated by goal difference, then goals scored; head-to-head rules, point deductions and split rounds are not modelled. This is a statistical projection, not a tip.
How good are the model's probabilities? Its match forecasts are scored publicly, every match, on the calibration record.
Use this table
Free to republish with credit and a link to this page (CC BY 4.0). Journalists: contact@football-charts.com for a club-specific version.